
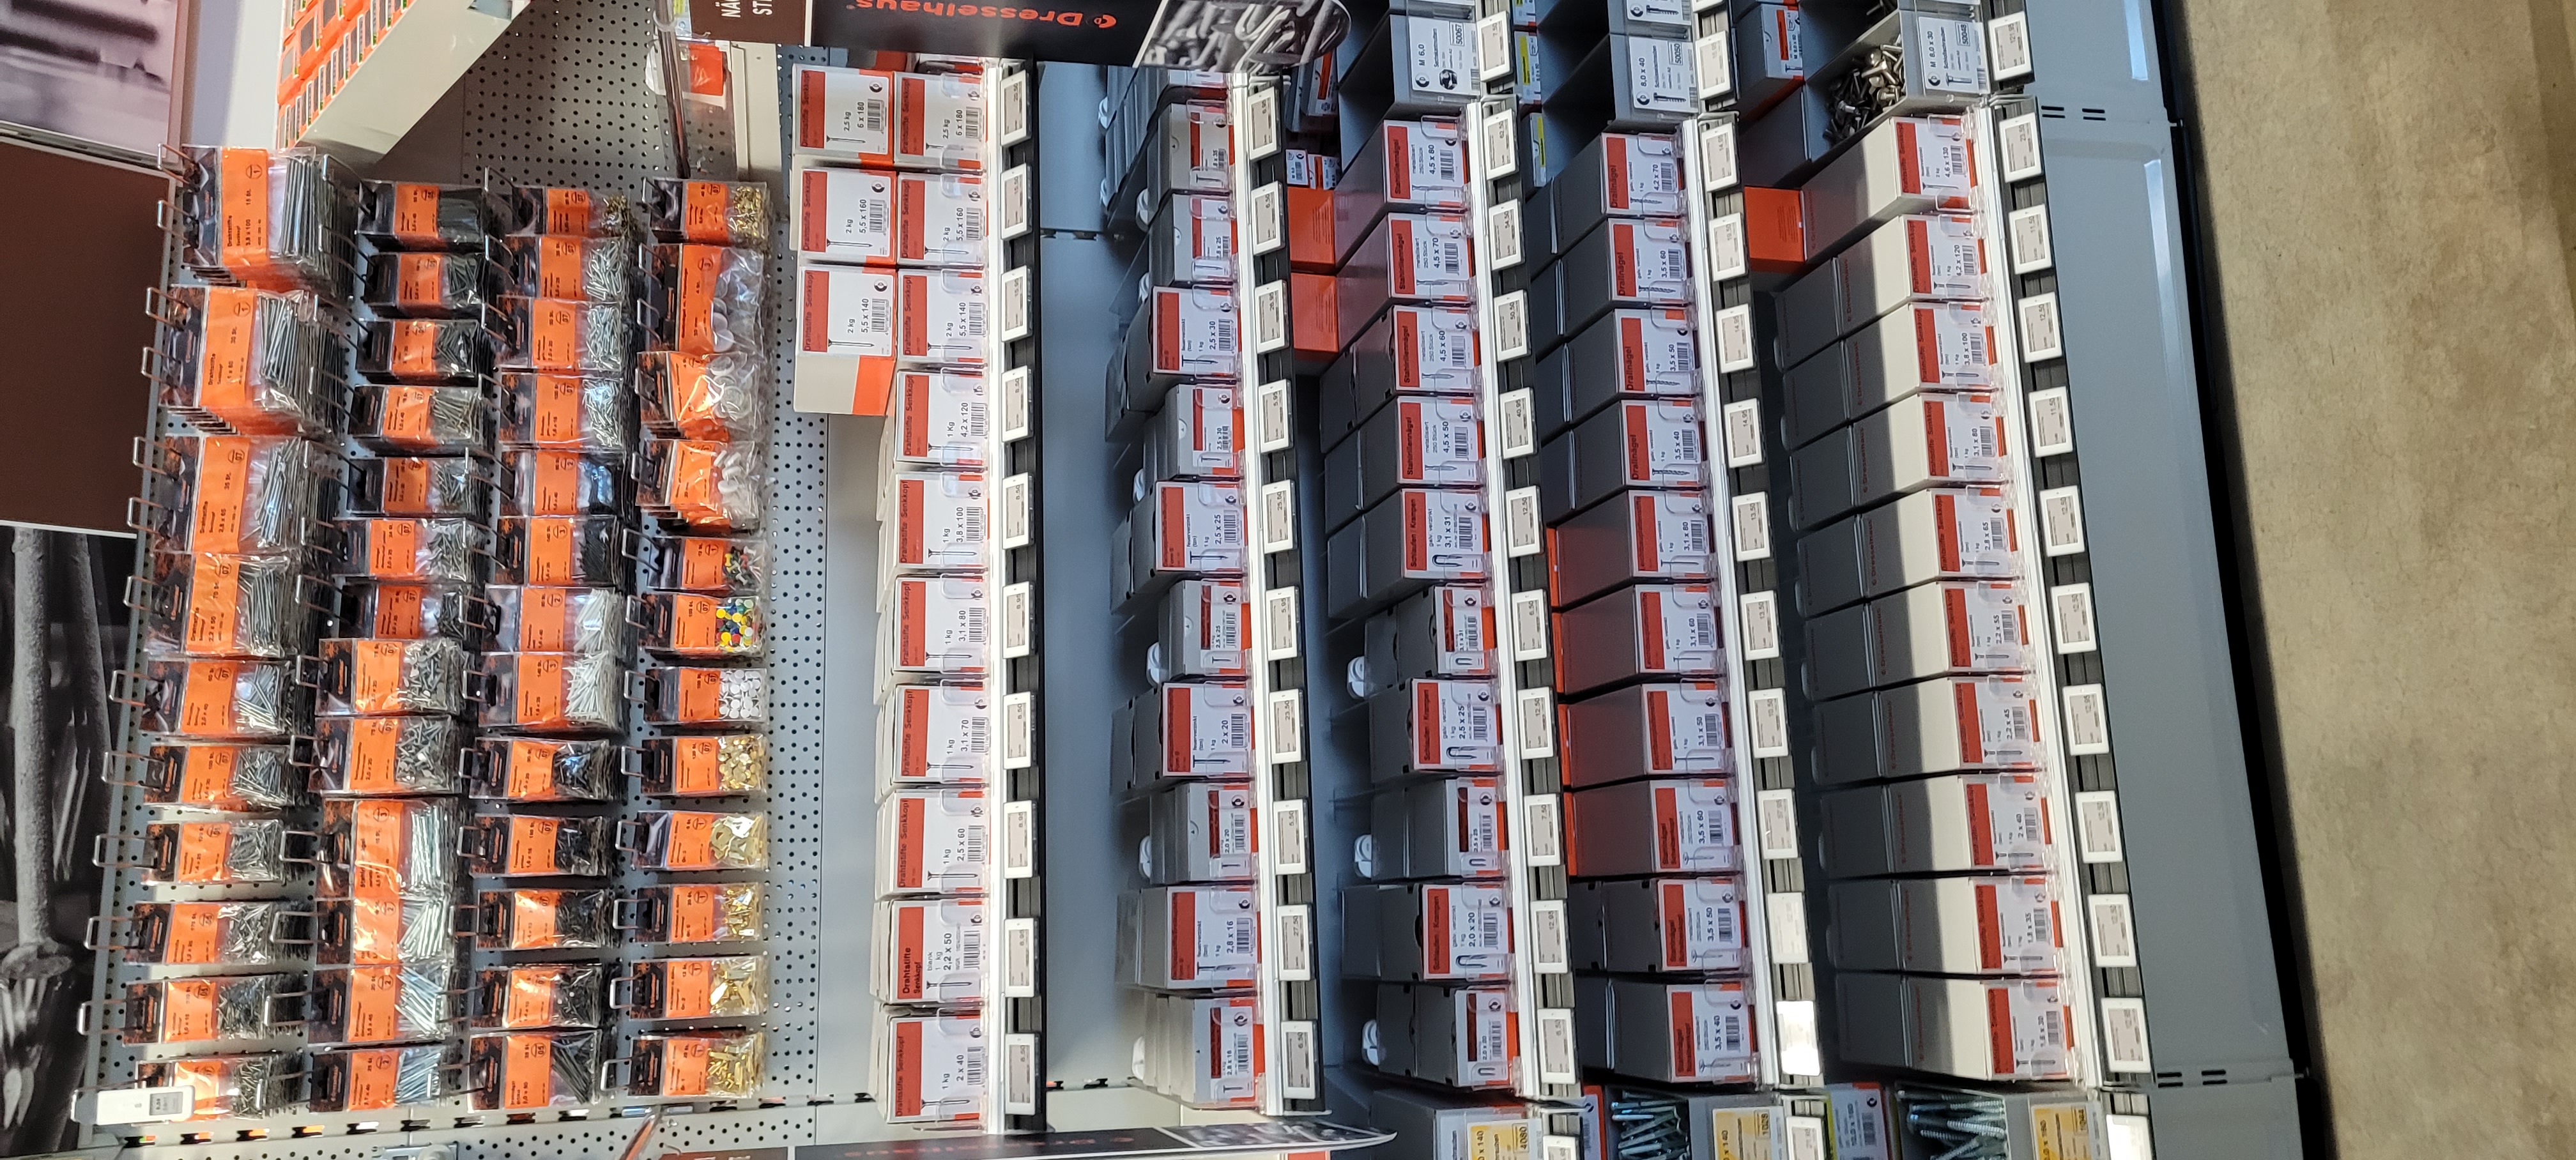
A planogram is the visual layout of which products go where on the shelf. Good planograms increase revenue per meter, reduce out-of-stock and ensure a consistent look across all your stores.
Start with data. Sales figures per SKU per m² of shelf space tell you where the revenue is. High-turnover products belong at eye level (1.20-1.60m). Slow movers can go lower or higher.
Think in categories, not individual products. A customer scans a shelf in seconds. Ensure products within the same category stand visually together, with logical sub-groups (e.g. basic, premium, private label).
Use dividers and shelf organizers to enforce structure. Without physical guides, the shelf shifts within days. Systems like EASYFIX also make rearrangement fast and repeatable across multiple stores.
Involve your staff. The people on the shop floor know what works and where problems lie. A planogram that is not practical will inevitably be adapted — better to get it right immediately.
Test in one store before rolling out a planogram change across your entire chain. Measure revenue effect over 2-4 weeks and adjust where needed.
And finally: price and category marking counts. Clear price tags (increasingly ESL) and shelf headers make your planogram readable for the customer.
Interesse in een vrijblijvende offerte?
We denken graag met u mee over uw winkelinrichting.
Vraag offerte aan